
 Sign in with Google
Key Concepts: Cost-Benefit Analysis, Employment/Unemployment, Marginal Analysis…
Students learn the meaning and measurement of six important economic indicators and use the St. Louis Federal Reserve Bank National Economic Trends website to assess the current state of the economy.
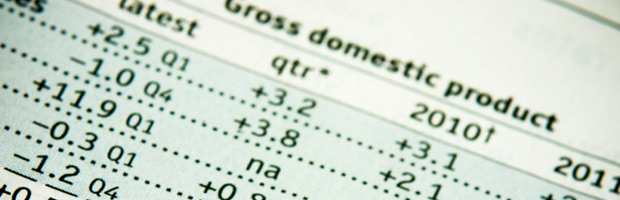
Gross Domestic Product. The Consumer Price Index. Industrial Production. Interest Rates. Changes in Non-farm Payrolls. The Unemployment Rate. Nearly every day, news reports inform the public about the state of the economy and changes in economic performance. Yet studies show that many Americans don’t understand what these indicators are, how they are calculated, or how they can be used to assess economic performance.
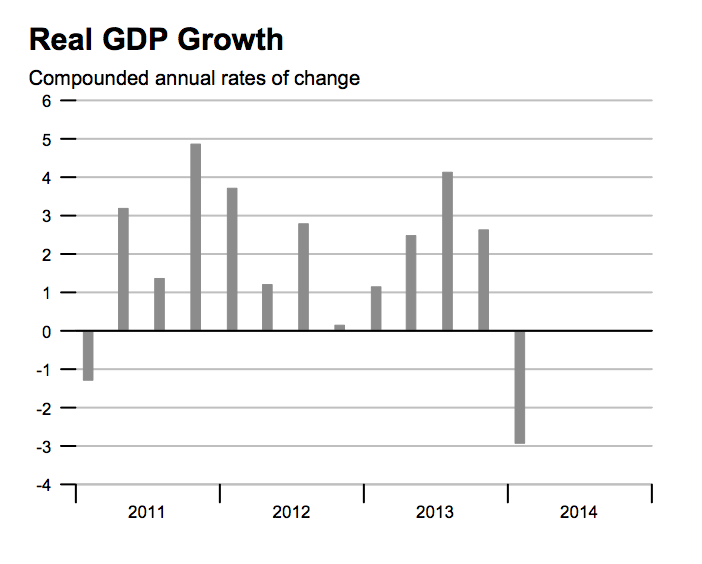
Gross Domestic Product (GDP) measures the dollar value of all goods and services produced in the U.S. economy in one year. The Department of Commerce Bureau of Economic Analysis measures the Gross Domestic Product by adding the spending in the consumer, investment (firms), government, and foreign (exports minus imports) sectors. While the current GDP can give us a good indication of current production, we must remove the effects of inflation from current GDP to compare the current figures to GDP numbers from other years. Real GDP is the current GDP divided by the GDP price deflator. The real GDP is one of the most important indicators of economic performance. A rise in real GDP indicates economic growth, while a fall in real GDP indicates economic decline. Use the chart above to see how Gross Domestic Product illustrates how our economy is performing. This chart was published by the Federal Reserve Bank of St. Louis.
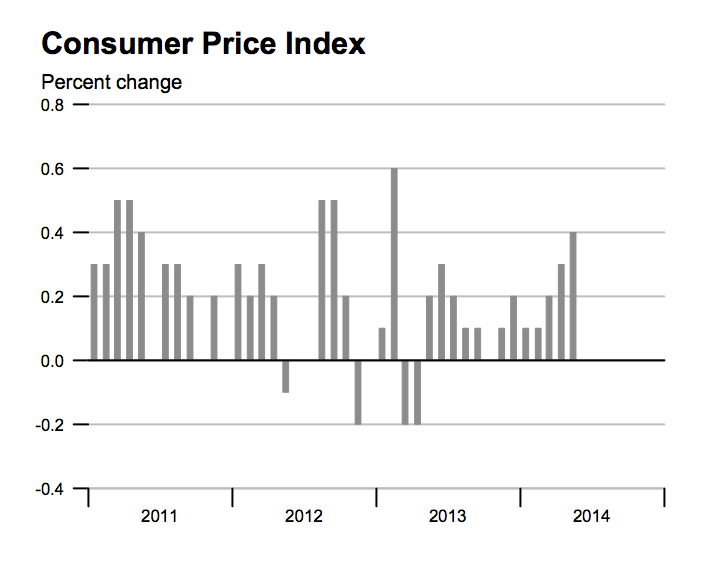
The Consumer Price Index (CPI) measures the change in the overall cost of a variety of consumer goods and services. The Department of Labor Bureau of Labor Statistics measures the Consumer Price Index by creating a market basket of thousands of items purchased by consumers — food, housing, clothing, transportation, medical care, recreation, education, communication, and energy. The prices of the specified products are measured each month, and the percentage change in price is reported as the Consumer Price Index. The Consumer Price Index generally increases during economic growth; during economic decline, the rate of price increase slows or prices may even decline. Use the chart above to see how the Consumer Price Index illustrates how our economy is performing. This chart was published by the Federal Reserve Bank of St. Louis.
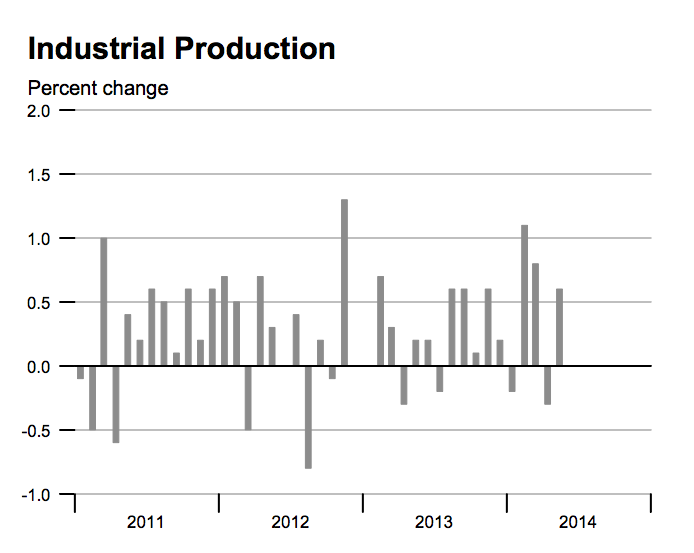
Industrial Production measures the output of American industry. The Federal Reserve Board of Governors measures Industrial Production by calculating the manufacturing output in the consumer goods, business equipment, construction supplies, materials, manufacturing, mining, and utility industries. Production is calculated in each sector monthly, and the percentage change in output is reported as Industrial Production. Durable goods, such as cars, appliances, and furniture, as well as construction supplies, tend to be more sensitive to economic changes than are other manufacturing products. Generally, Industrial Production increases during economic growth and falls during periods of economic decline. Use the chart above to see how Industrial Production illustrates how our economy is performing. This chart was published by the Federal Reserve Bank of St. Louis.
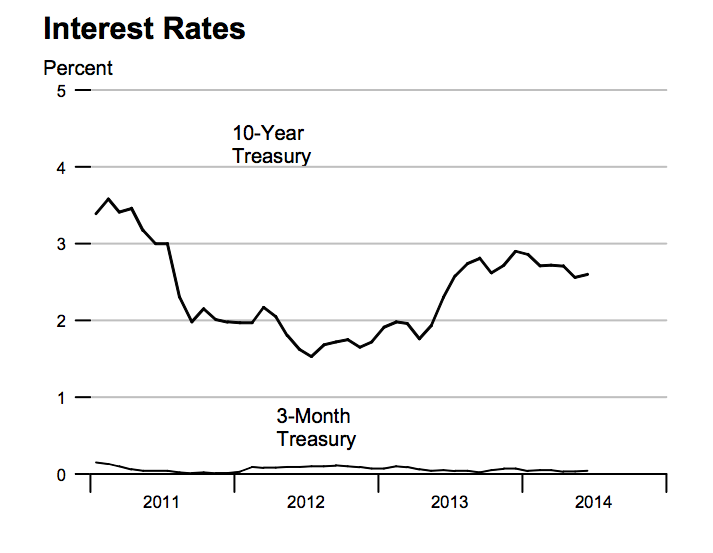
The Ten-Year Treasury Interest Rate measures the percentage return investors receive on U.S. Treasury bonds. The Federal Reserve Board of Governors measures Ten-Year Treasury Interest Rates, as determined daily in the bond market. Treasury Interest Rates can be indicative of changes in other long-term interest rates such as mortgages and long-term business loans. A decline in interest rates can precede increased investment spending to promote economic growth; high interest rates can lead to lower levels of investment and a decline in the rate of growth. Use the chart above to see how Interest Rates illustrate how our economy is performing. This chart was published by the Federal Reserve Bank of St. Louis.
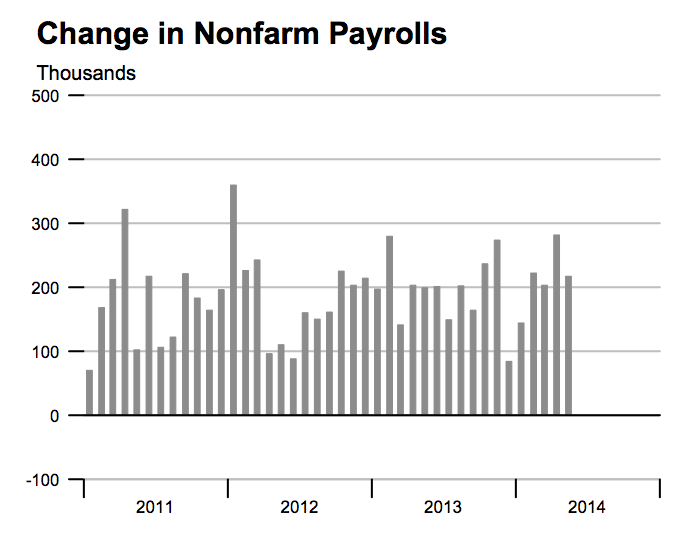
The Change in Non-farm Payroll measures the number of people employed by companies and government. The Department of Labor Bureau of Labor Statistics surveys approximately 144,000 businesses and government agencies to count the number of people employed each month, and the change from the previous month in the number of employed people is reported as the Change in Non-farm Payrolls. Non-farm Payroll generally rises during economic growth and falls during economic decline. Use the chart above to see how Change in Non-farm Payrolls illustrates how our economy is performing. This chart was published by the Federal Reserve Bank of St. Louis.
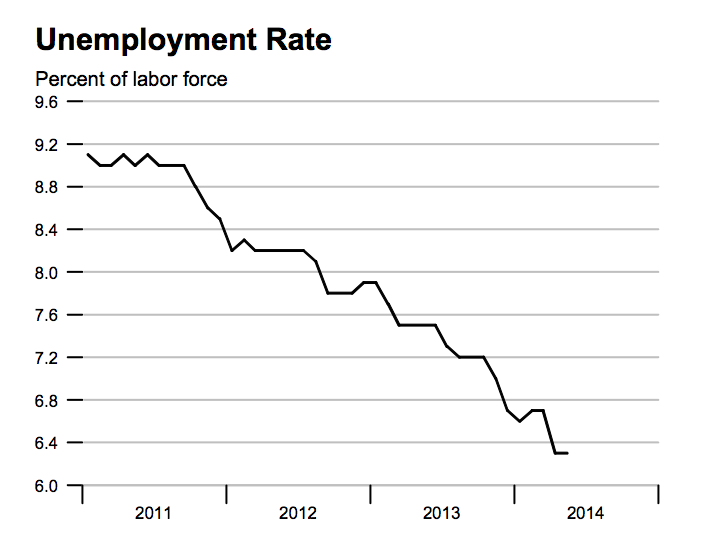
The Unemployment Rate measures the percentage of people in the labor force who were not working during the week of the survey, but had specifically looked for work within the previous four weeks (unless they were waiting to be recalled from layoff, in which case they need not have been looking for work to be counted as unemployed). The Department of Labor Bureau of Labor Statistics surveys thousands of Americans each month to calculate the size of the labor force (those working plus those not working, but seeking work) and the unemployment rate (the unemployed divided by the labor force). The number of people unemployed as a percentage of the labor force is reported each month as the Unemployment Rate. The Unemployment Rate generally falls during economic growth and rises during economic decline. Use the chart above to see how the Unemployment Rate illustrates how our economy is performing. This chart was published by the Federal Reserve Bank of St. Louis.
When these indicators are analyzed in concert, the developing pattern can help to illustrate current economic performance. Periods of economic growth are often fueled by increased demand for economic products. This increased demand often causes GDP to increase, while simultaneously causing prices to go up. Firms increase their production to meet that increased demand, and often hire additional workers, increasing the payroll and reducing the unemployment rate. The increased demand for products can also result in increased demand for loans to purchase products, increasing interest rates. Recessions, on the other hand, are often fueled by a reduction in demand for goods and services. Firms reduce production in response, lowering GDP, and prices. Production cutbacks lead firms to lay off workers, increasing the unemployment rate. Reduced demand for loans can result in lower interest rates, and the Federal Reserve may further reduce interest rates in an attempt to stimulate spending in the economy.
To see how all six of the indicators illustrate how our economy is performing, go to the https://files.stlouisfed.org/files/htdocs/publications/net/page3.pdf website.
To learn more on how economic indicators are calculated go the the fundamental analysis website.
While the myriad of economic data can be confusing, an understanding of the basic indicators of economic performance can help people to understand what is happening in the economy and prepare for the possibility of economic downturns or upturns.
Use the following Data Retrieval Chart to have your students evaluate what they have learned.
Use the pdf data file on the https://files.stlouisfed.org/files/htdocs/publications/net/page3.pdf website to assess the current performance of our economy by answering the questions below.

Content Partner
Grades Higher Education, 9-12
Grades 9-12

Grades 9-12