
 Sign in with Google
Content Partner
Grades 6-8, 9-12
Inflation 101
In this lesson, you will learn about what inflation is, why you should care about it, and how the Federal...
Key Concepts: Inflation
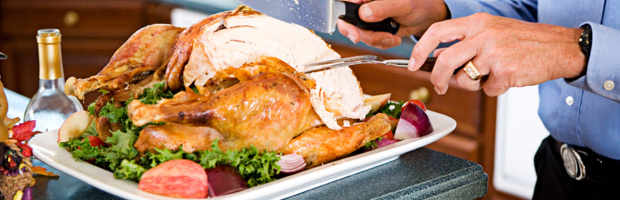
 How does your family celebrate Thanksgiving? Are you joined by friends and/or family for a special feast? What do you eat? Most American families celebrate Thanksgiving by cooking turkey. According to EatTurkey.com, approx. 88 percent of U.S. households eat turkey on Thanksgiving at an average weight of 16 lbs a turkey that adds up to 736 million pounds that will be eaten this Thanksgiving.
Have you ever wondered what it costs to prepare a traditional Thanksgiving meal of turkey, stuffing, sweet potatoes, pumpkin pie, cranberries, and other goodies? The American Farm Bureau Federation (AFBF) has conducted a Thanksgiving dinner price survey for each year since 1986. Surveyed shoppers are asked to report local costs of twelve basic items found on the dinner table on Thanksgiving day. Survey responses are used to determine the average cost of a Thanksgiving dinner prepared for 10 people.
See “Classic Thanksgiving Dinner Costing More in 2011 .”
In this lesson you will what a price index is, what it represents, and how inflation and deflation are shown through the change in the price index. You will also explain that a price index is constructed by comparing current prices of a market basket of items to the prices of the same market basket of items in some base year. Finally, you will create your own price index and describe some of the events that can cause a change in prices of agricultural.
A Thanksgiving Market Basket
The twelve components of the survey can be thought of as a Thanksgiving market basket of items. This is similar to the procedure that is used in tabulating the monthly Consumer Price Index (CPI). The CPI measures the monthly change in the cost of a fixed market basket of items that is purchased by the typical urban household. The monthly cost of this market basket is compared to the cost of the same basket during a predetermined base year (this is the year in which the price index is usually set equal to 100 that is used to compare changes in economic variables). By comparing the current CPI to its base-year value, we can see how much the average price level has changed over time. We can also use two consecutive annual CPI measurements to determine the rate of inflation (an increase in the average price level) or deflation (a decrease in the average price level).
The years from 1982-84 are considered the base period in the construction of the CPI. That is, 1982-84 = 100 in calculating the CPI.
Return to “Classic Thanksgiving Dinner Costing More in 2011. ”
Note the market basket of items in the Thanksgiving Day dinner survey. In the following table, you will find the 12 items in the Thanksgiving market basket and their 2010 & 2011 prices. Note that, unlike the CPI, the AFBF survey is not intended to be scientific. In addition, while items in the CPI market basket are weighted by their relative importance in household purchases, no such weighting scheme is employed here (although the largest cost item, turkey, does account for over 40 percent of the total cost of the Thanksgiving market basket).
The AFBF has tracked the average cost of the same basket of Thanksgiving dinner items since 1986. This allows us to make meaningful comparisons of the total costs reported in past surveys.
| MARKET BASKET ITEM | 2011 | 2010 | Percent Change from 2009-2010 |
| 16-pound turkey | $21.57 | $17.66 | |
| 14-oz. package of cubed stuffing | $2.88 | $2.64 | |
| 1 gallon of whole milk | $3.66 | $3.24 | |
| 3 lbs. of sweet potatoes | $3.26 | $3.19 | |
| 12-oz. package of brown-and-serve rolls | $2.30 | $2.12 | |
| 30-oz. can of pumpkin pie mix | $3.03 | $2.62 | |
| 12-oz. package of fresh cranberries | $2.48 | $2.41 | |
| Package of 2 nine-inch pie shells | $2.52 | $2.46 | |
| 16-oz. package of frozen green peas | $1.68 | $1.44 | |
| Combined group of miscellaneous items (including coffee and ingredients to prepare the meal) | $3.10 | $3.22 | |
| 1-pound relish tray (carrots and celery) | $0.76 | $0.77 | |
| 1/2 pint of Cream | $1.96 | $1.70 | |
| Total cost of market basket | $49.20 | $43.47 |
A price index for a given year is calculated by comparing the cost of the market basket of items in the current year to its cost in the base year. Specifically, a current year price index can be calculated as:
A Thanksgiving Price Index
(Current cost of market basket/Base year cost of market basket) x 100
Thus, the price index in the base year equals 100 since the current cost of the market basket must equal the base year cost since they are the same.
This allows us to compile a Thanksgiving price index using past information reported by AFBF. For example, if we use 1986 as the base year, then the Thanksgiving price index equals 100 in 1986 (calculated as {$28.74/$28.74}x100). In 1987, the price index declines to 85.3 (calculated as {$24.51/$28.74}x100).
Activity
Using the information reported in “Classic Thanksgiving Dinner Costing More in 2011,” compile a Thanksgiving price index.
| Year | Index | Year | Index |
| 1986 | 100 | 1999 | |
| 1987 | 85.3 | 2000 | |
| 1988 | 2001 | ||
| 1989 | 2002 | ||
| 1990 | 2003 | ||
| 1991 | 2004 | ||
| 1992 | 2005 | ||
| 1993 | 2006 | ||
| 1994 | 2007 | ||
| 1995 | 2008 | ||
| 1996 | 2009 | ||
| 1997 | 2010 | ||
| 1998 | 2011 |
The price system in a market economy is subject to constant changes in information about the relative values of goods and services. Changes in prices are a reflection of new information being digested by the market about the supply and demand for goods. The goal of calculating inflation is to determine whether or not the changes in price are real or nominal phenomena. Given the fact that the supply of money and credit typically expanding, one can assume that over time prices will rise at some rate. However, the rate of increase is not given and can usually only be determined after the fact. By calculating the rate of inflation, individuals can determine whether or not the price increases or decreases are subject to the forces of supply and demand or if they are caused by a loss or gain in purchasing power of a currency.
Content Partner
Grades 6-8, 9-12

Grades 6-8, 9-12
Grades 9-12
Content Partner
Grades 9-12