Objective
Students will be able to:
- Create a graph representing a budget line and calculate the trade-offs of moving along the line.
- Represent a budget line using an equation in two variables.
- Predict transformations of the budget line given changes in income, changes in price of a good, or both.
- Calculate an equation for a budget line.
- Explain the meaning of the budget line in terms of personal finance.

Assessment
- Bill has $10 dollars to spend on chips and soda. If the price of chips is $1 and the price of a soda is $2, which equation represents the relationship between Bill’s income and the quantity of chips (x) and soda (y) he can purchase with his money?
- 10 = 2x + 1y
- [10 = 1x + 2y]
- 10 = x + y
- 10 = ½ x + y
- Bill has $10 dollars to spend on chips and soda. If the price of chips is $1 and the price of a soda is $2, which graph represents the relationship between Bill’s income and the quantity of chips (x) and soda (y) he can purchase with his money?
a. 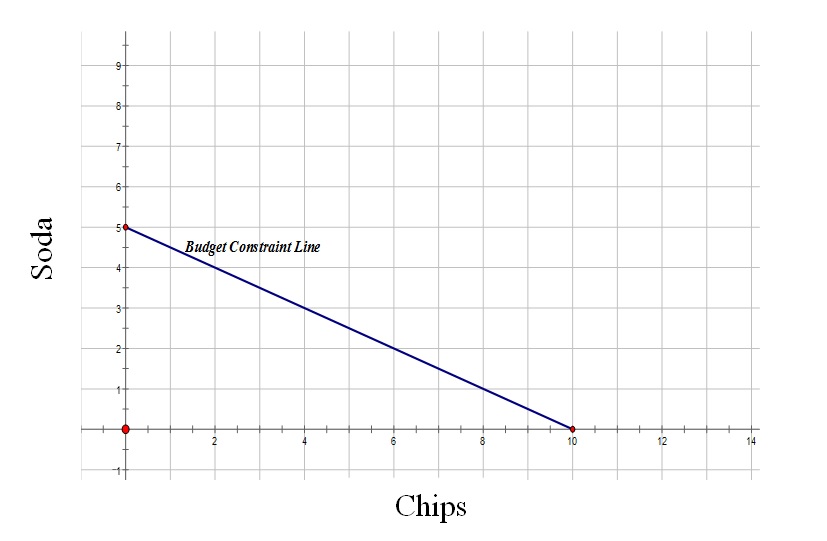
b. 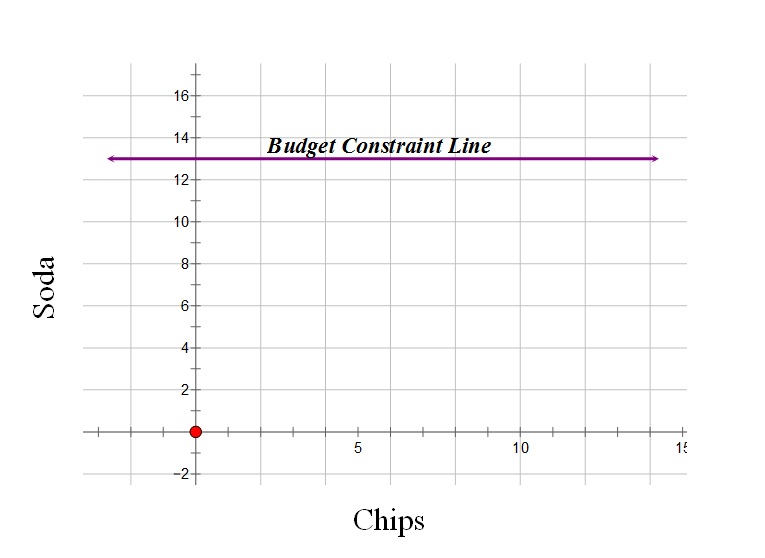
c. 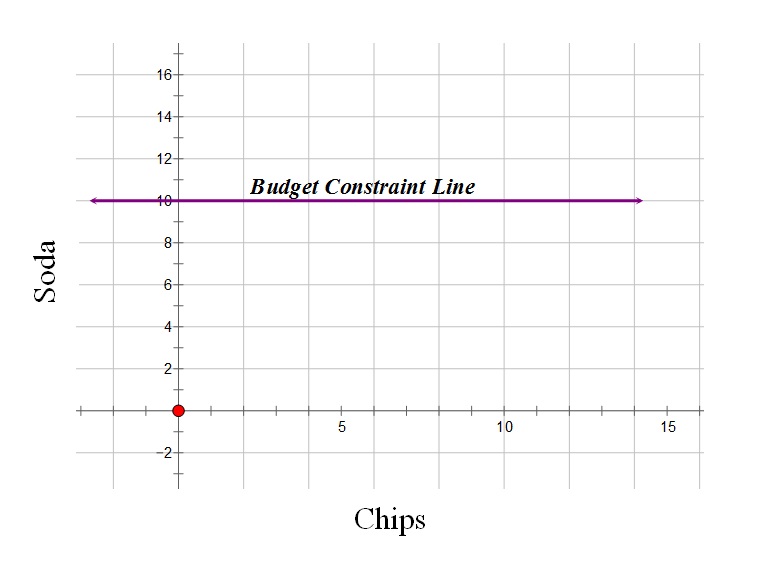
d. 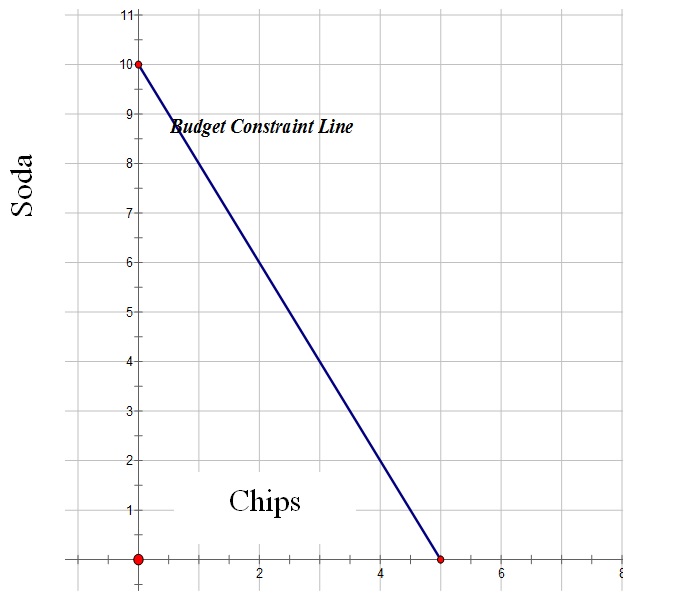
[Answer: a.]
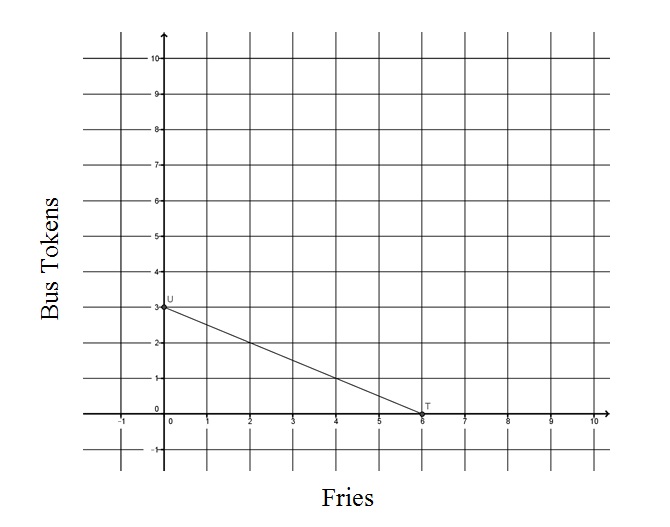
- Create a graph of the budget constraint line if Pat’s income is 12 dollars, bus tokens are four dollars, and fries are two dollars.
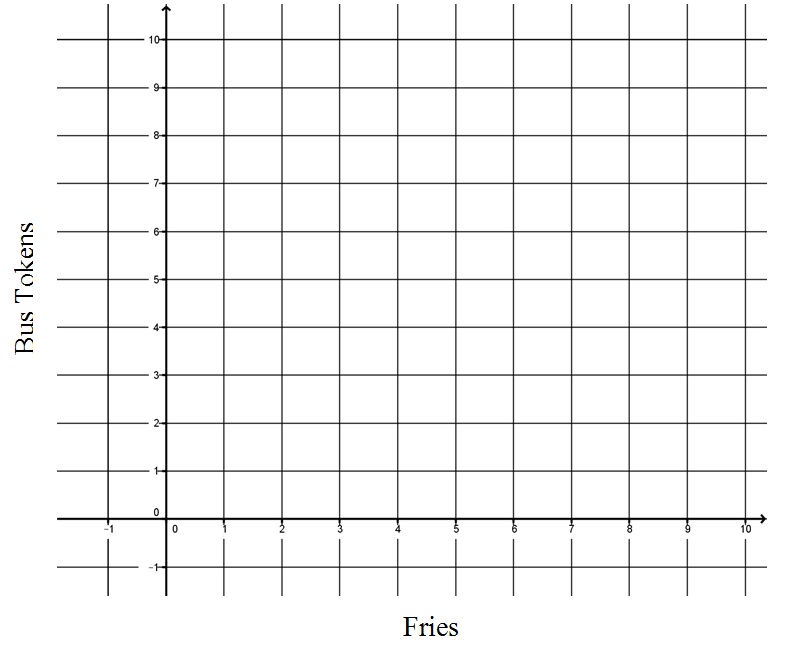
Answer: